Build Dashboard Radiator - Your Build Light ++
Why do we need more than a build light?
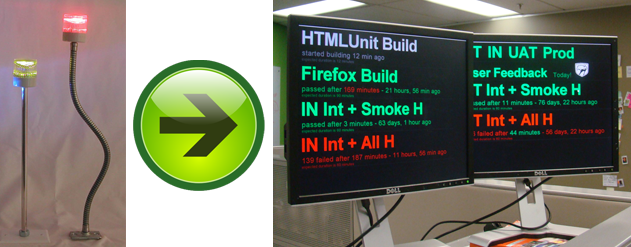
I'm really impressed and happy with how Continuous Integration (CI) has been widely used and accepted by many companies lately. However, sometimes the CI build is placed in the refrigerator where it just breaks and no one notices for many reasons, perhaps because people usually receive an e-mail notification that gets ignored or even moved to a folder that is never read. In order for us to gain as much as possible from what CI brings to us the CI build results have to be visible as a radiator. One of the ways of making CI results visible is by using a build light, which can go green or red depending on the results of the build. What we have noticed on our current project is that the colour of the light would not be enough information to be visible to the team. Our smart colleague Dave Yeung created a Build Dashboard Radiator for us.

What else do I get from a Build Dashboard Radiator?
Ideally it should provide you with more information than just whether or not the build has passed. It can, and should, be customised for each project. For example:
- Build time
- How many tests failed
- If you have different builds you should be able to know which one failed
- Different test environments that can go up and down and you want to keep track of
Implementation for Hudson
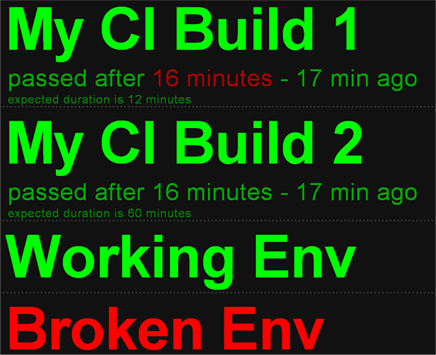
The concept of a Build Dashboard Radiator can be accomplished for any CI Server such as Cruise, Hudson or TeamCity. Dave’s implementation works for Hudson. This implementation requires Grease Monkey so that we can use GM_xmlhttpRequest which allows us to do asynchronous http request to our Hudson server. With this implementation we managed to keep track of Hudson’s builds, including its time and also our stage environments. If you follow the a step by step tutorial below to install our Hudson implementation you will be able to keep track of Hudson Builds and Environment Availability. This is the result page of our examples file inside the tutorial pack. It shows 2 builds and 2 environments.

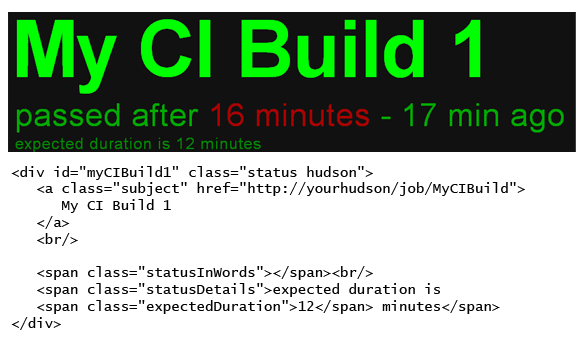
Hudson’s Builds:
You can add as many Hudson builds as you want to your dashboard in a declarative html way:  As you can see, you can also make sure that your build time does not exceed a particular time that you can define using:
12 minutes
Exceeding the expected duration represents a kind of build failure that you can see from the dashboard and act on it ASAP.
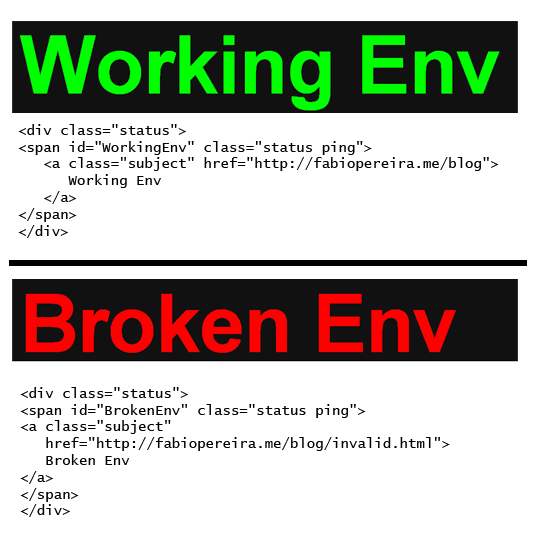
Environment Availability:
If you are developing a web application, you might have multiple environments that you want to make sure are available, such as Integration, UAT and even Production. We use the dashboard to get to know as soon as possible if one of these environments is offline:  What this does is basically ping the page from the href and check if the http response is 200 (success). Simplicity! :)
Step by step tutorial and Code
- Install Firefox and Grease Monkey plug-in
- This is the reason why I unpublished this post and I am publishing it again now. The new grease monkey does not allow by default the interception of local files. To enable that you have to open firefox config page with about:config and change the property greasemonkey.fileIsGreaseable to true. This image might help
- Download the code from github.com/creade/Radiatr
- Drag and drop grease monkey script (file build-dashboard-radiator.user.js) to your Firefox. Grease monkey will attempt to install it, confirm the installation. IMPORTANT! You have to drag and drop the file in order for Grease Monkey to install it properly. Do not use the normal Grease Monkey installation process, which is via the plug-in install button.
- Open the example file (build-dashboard-radiator-examples.html)
- You can change the examples and the css files to your needs.
I hope it’s as useful for you guys as it has been for us so far…
Thanks again Dave.